Statistics
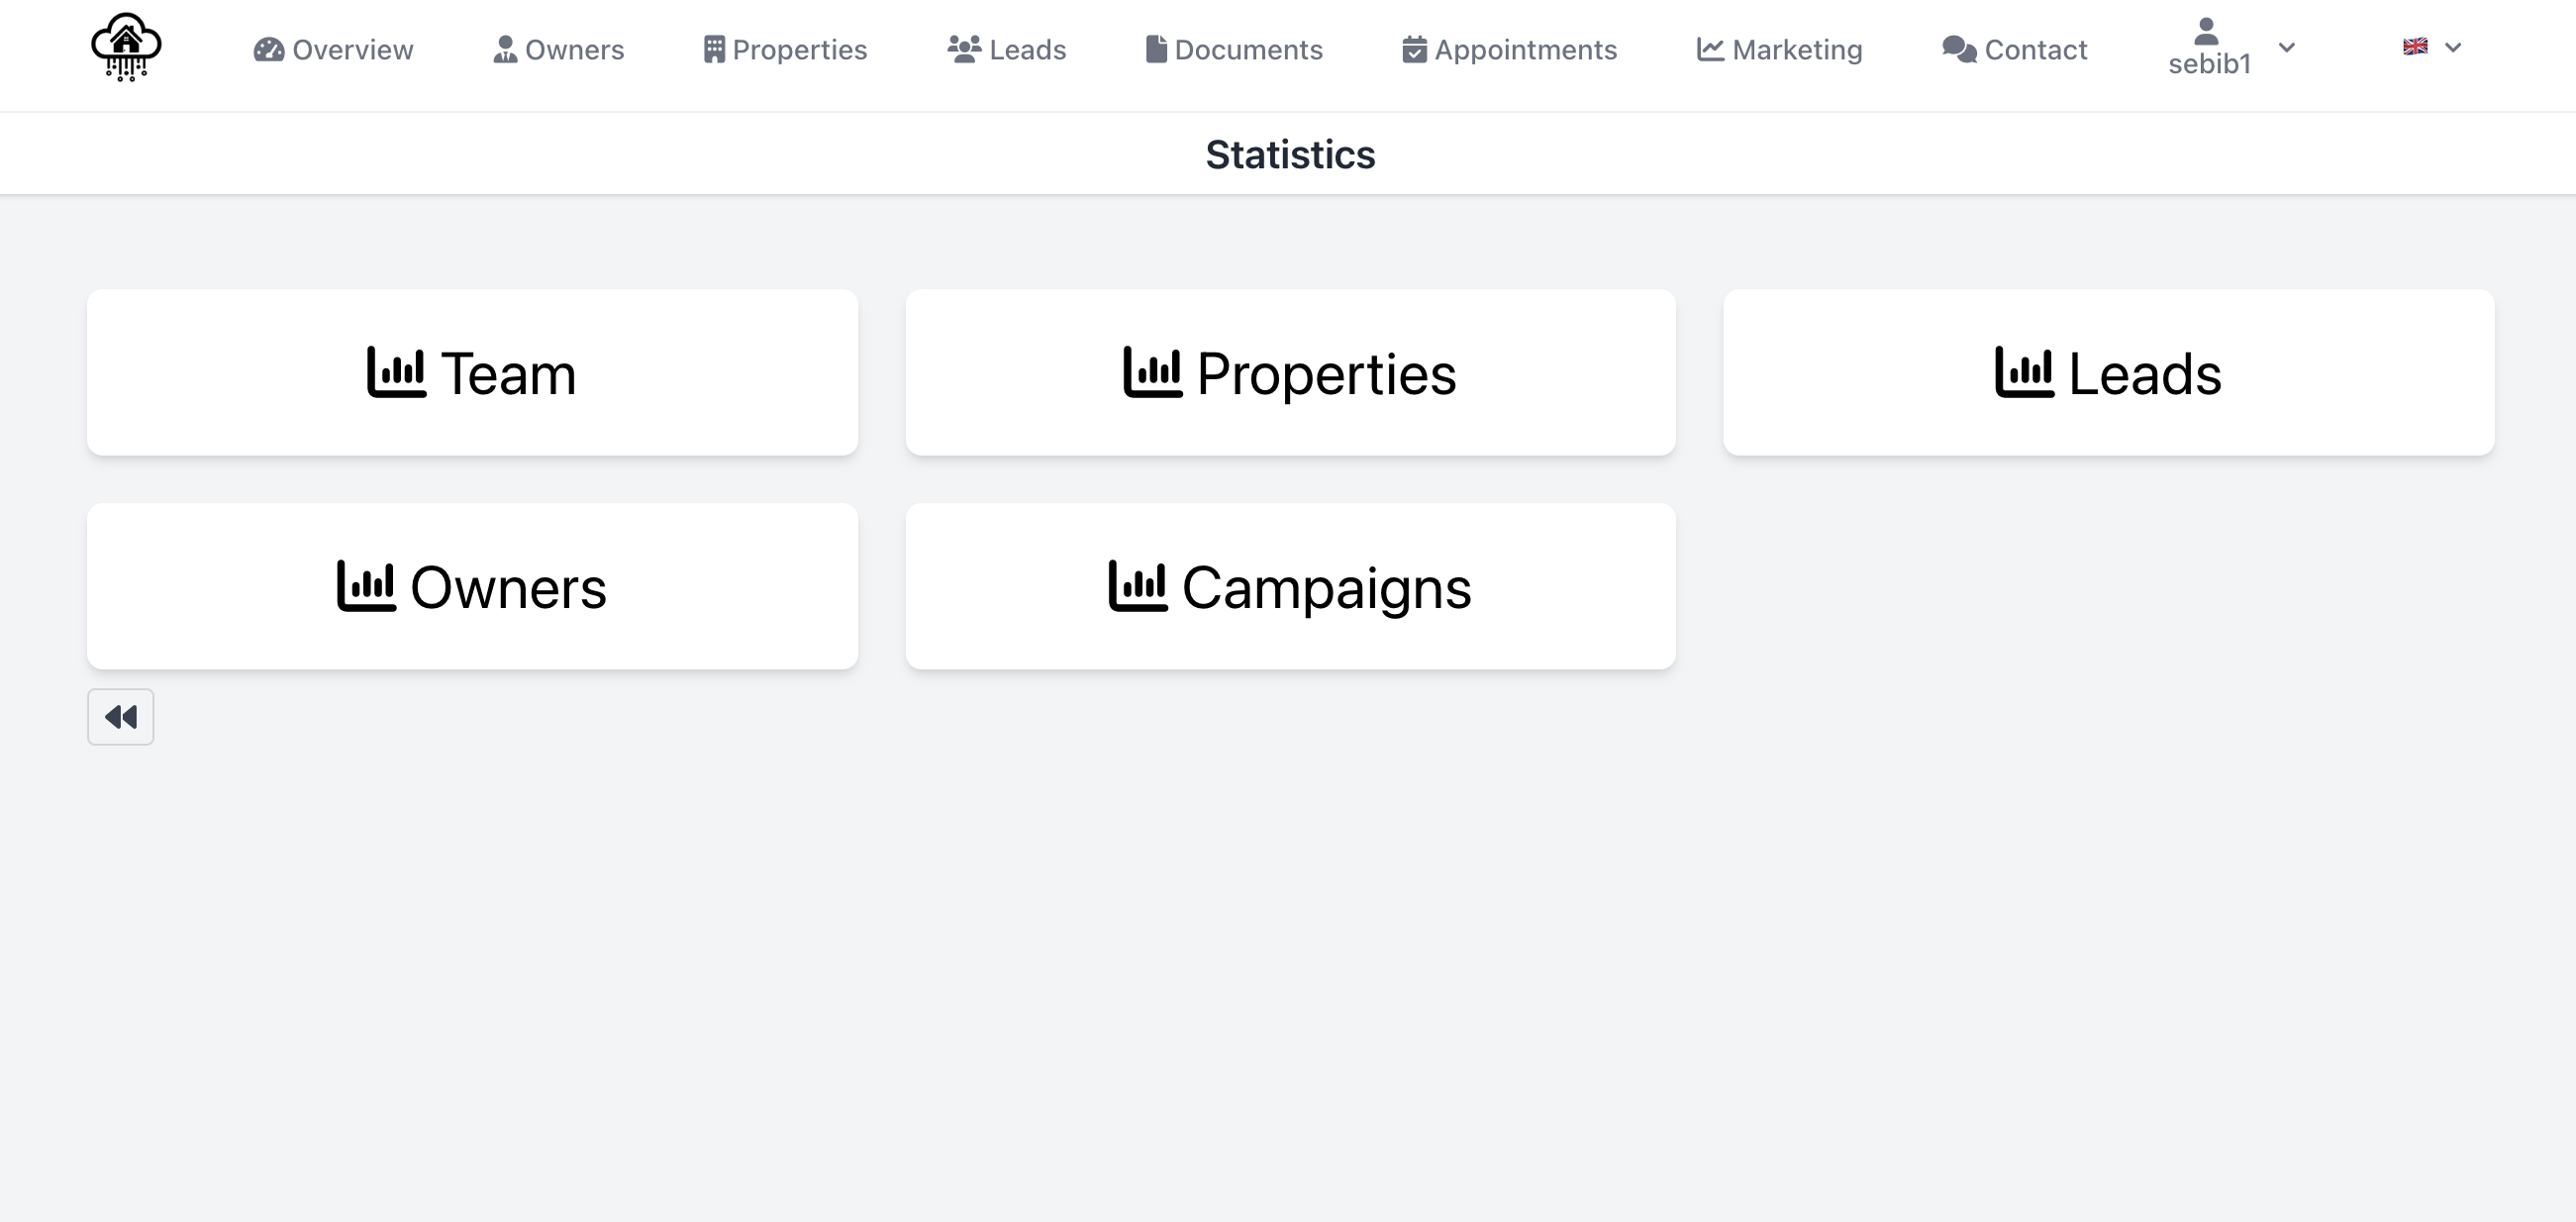
Statistics Menu
This image displays the clear and intuitive menu of the PropertyCloudCRM real estate broker software, enabling quick access to comprehensive real estate statistics. With this navigation, brokers can efficiently retrieve all relevant performance metrics and market data.
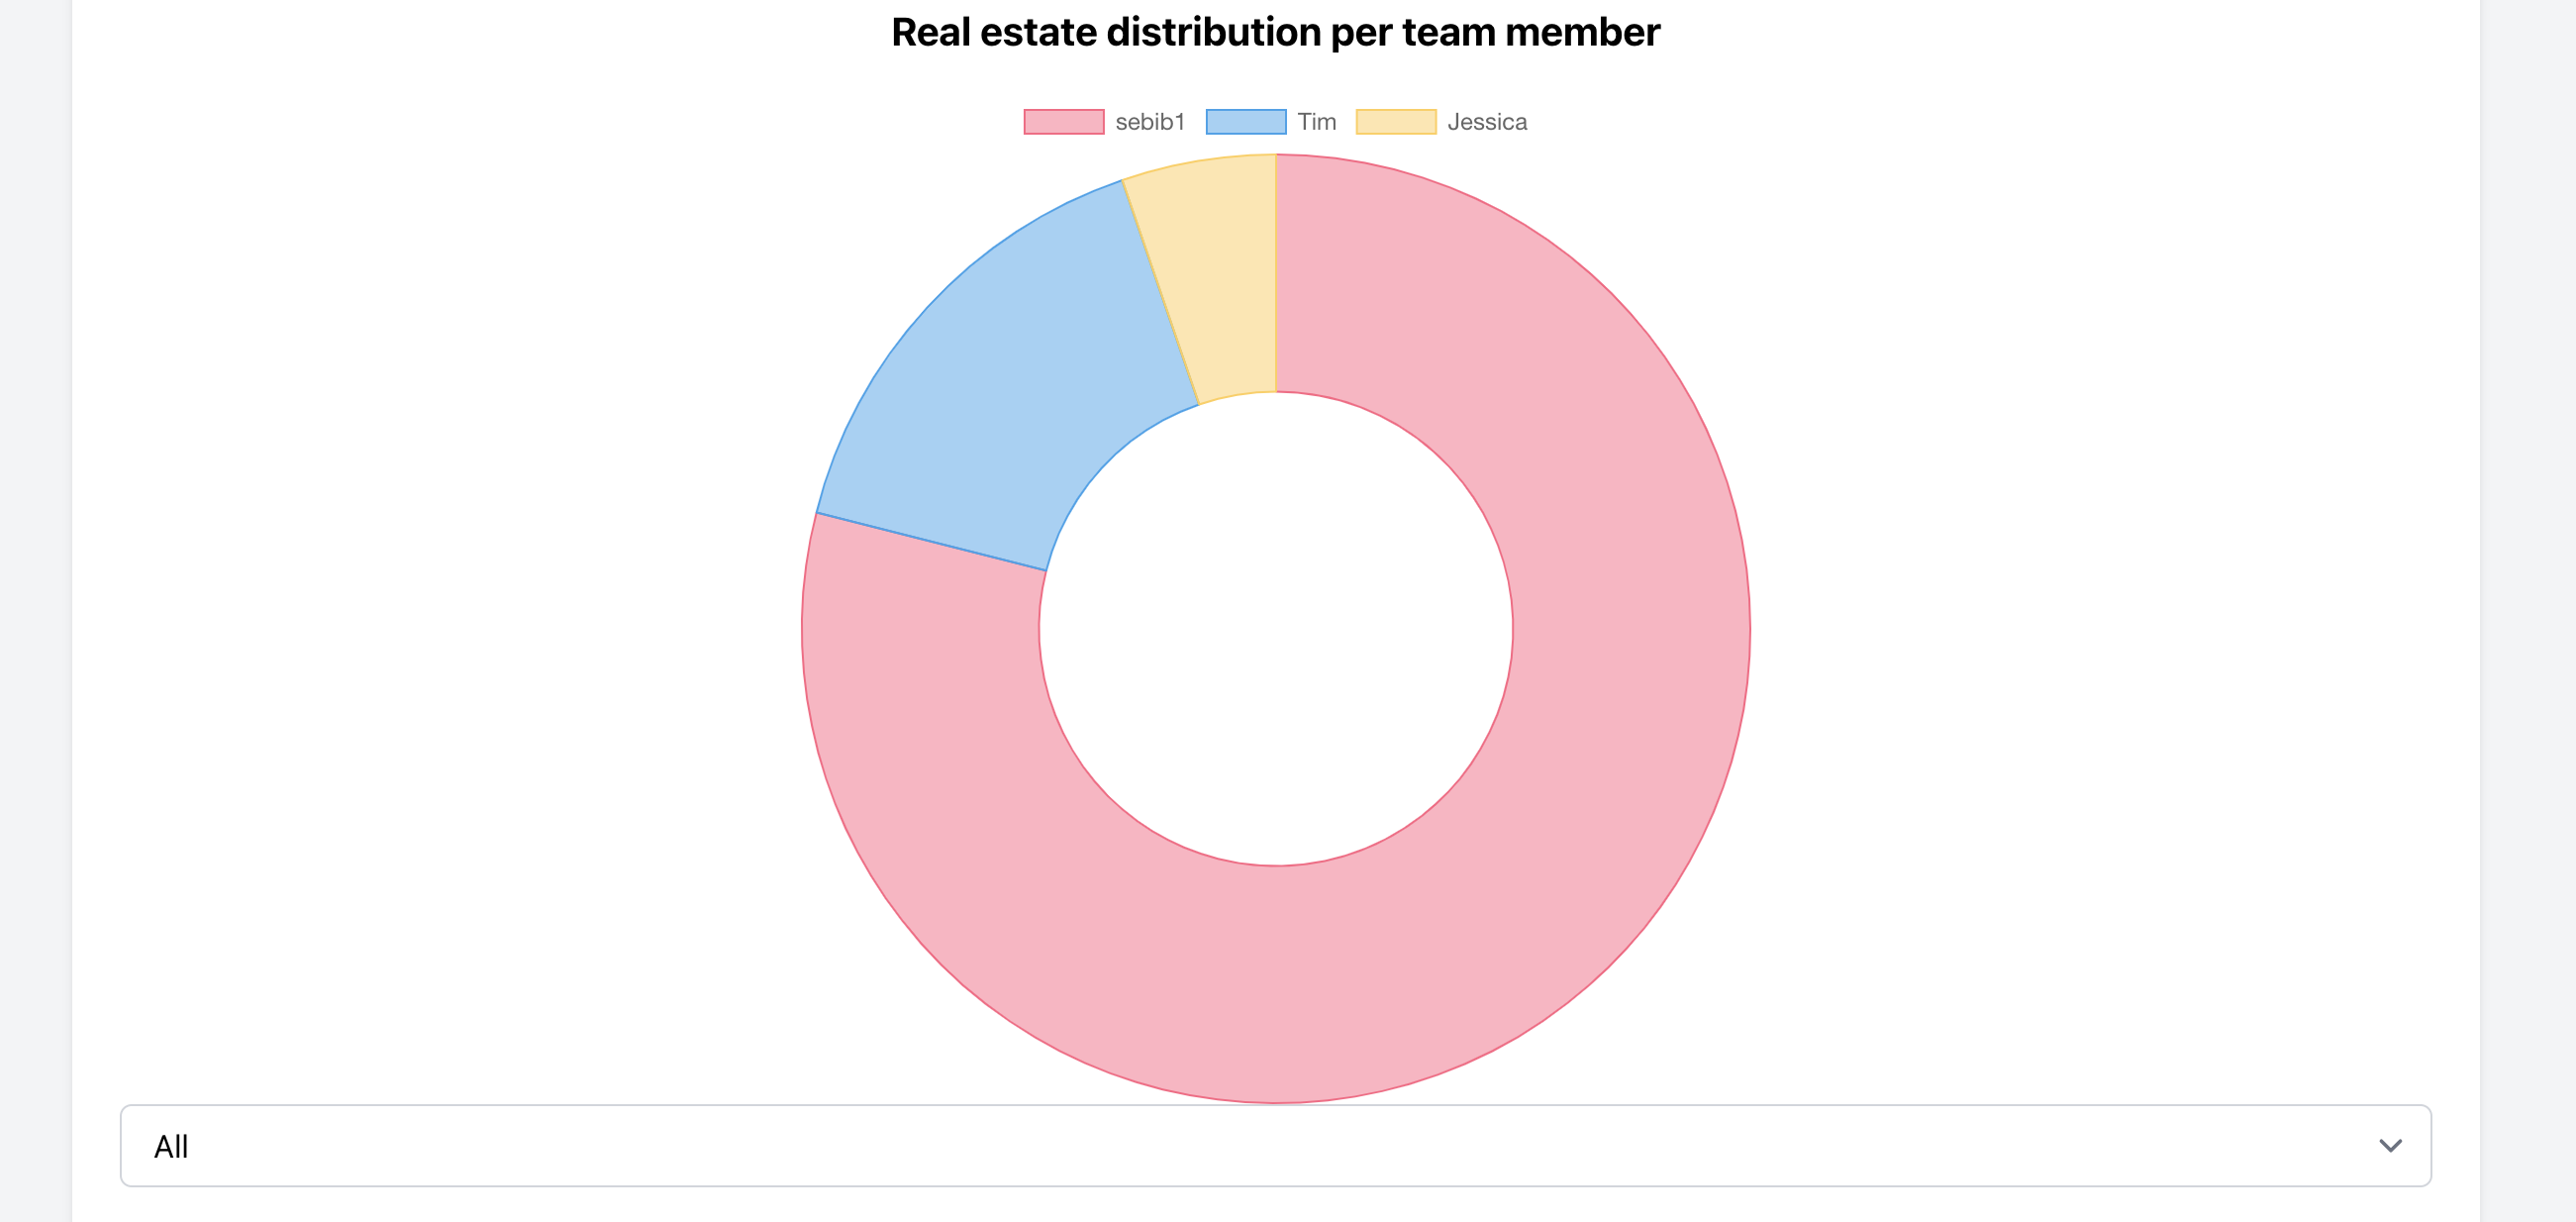
Property Distribution per Team Member
The donut chart visualizes the distribution of properties among team members in PropertyCloudCRM. It shows how many properties each broker manages – ideal for effective workload allocation in real estate management.
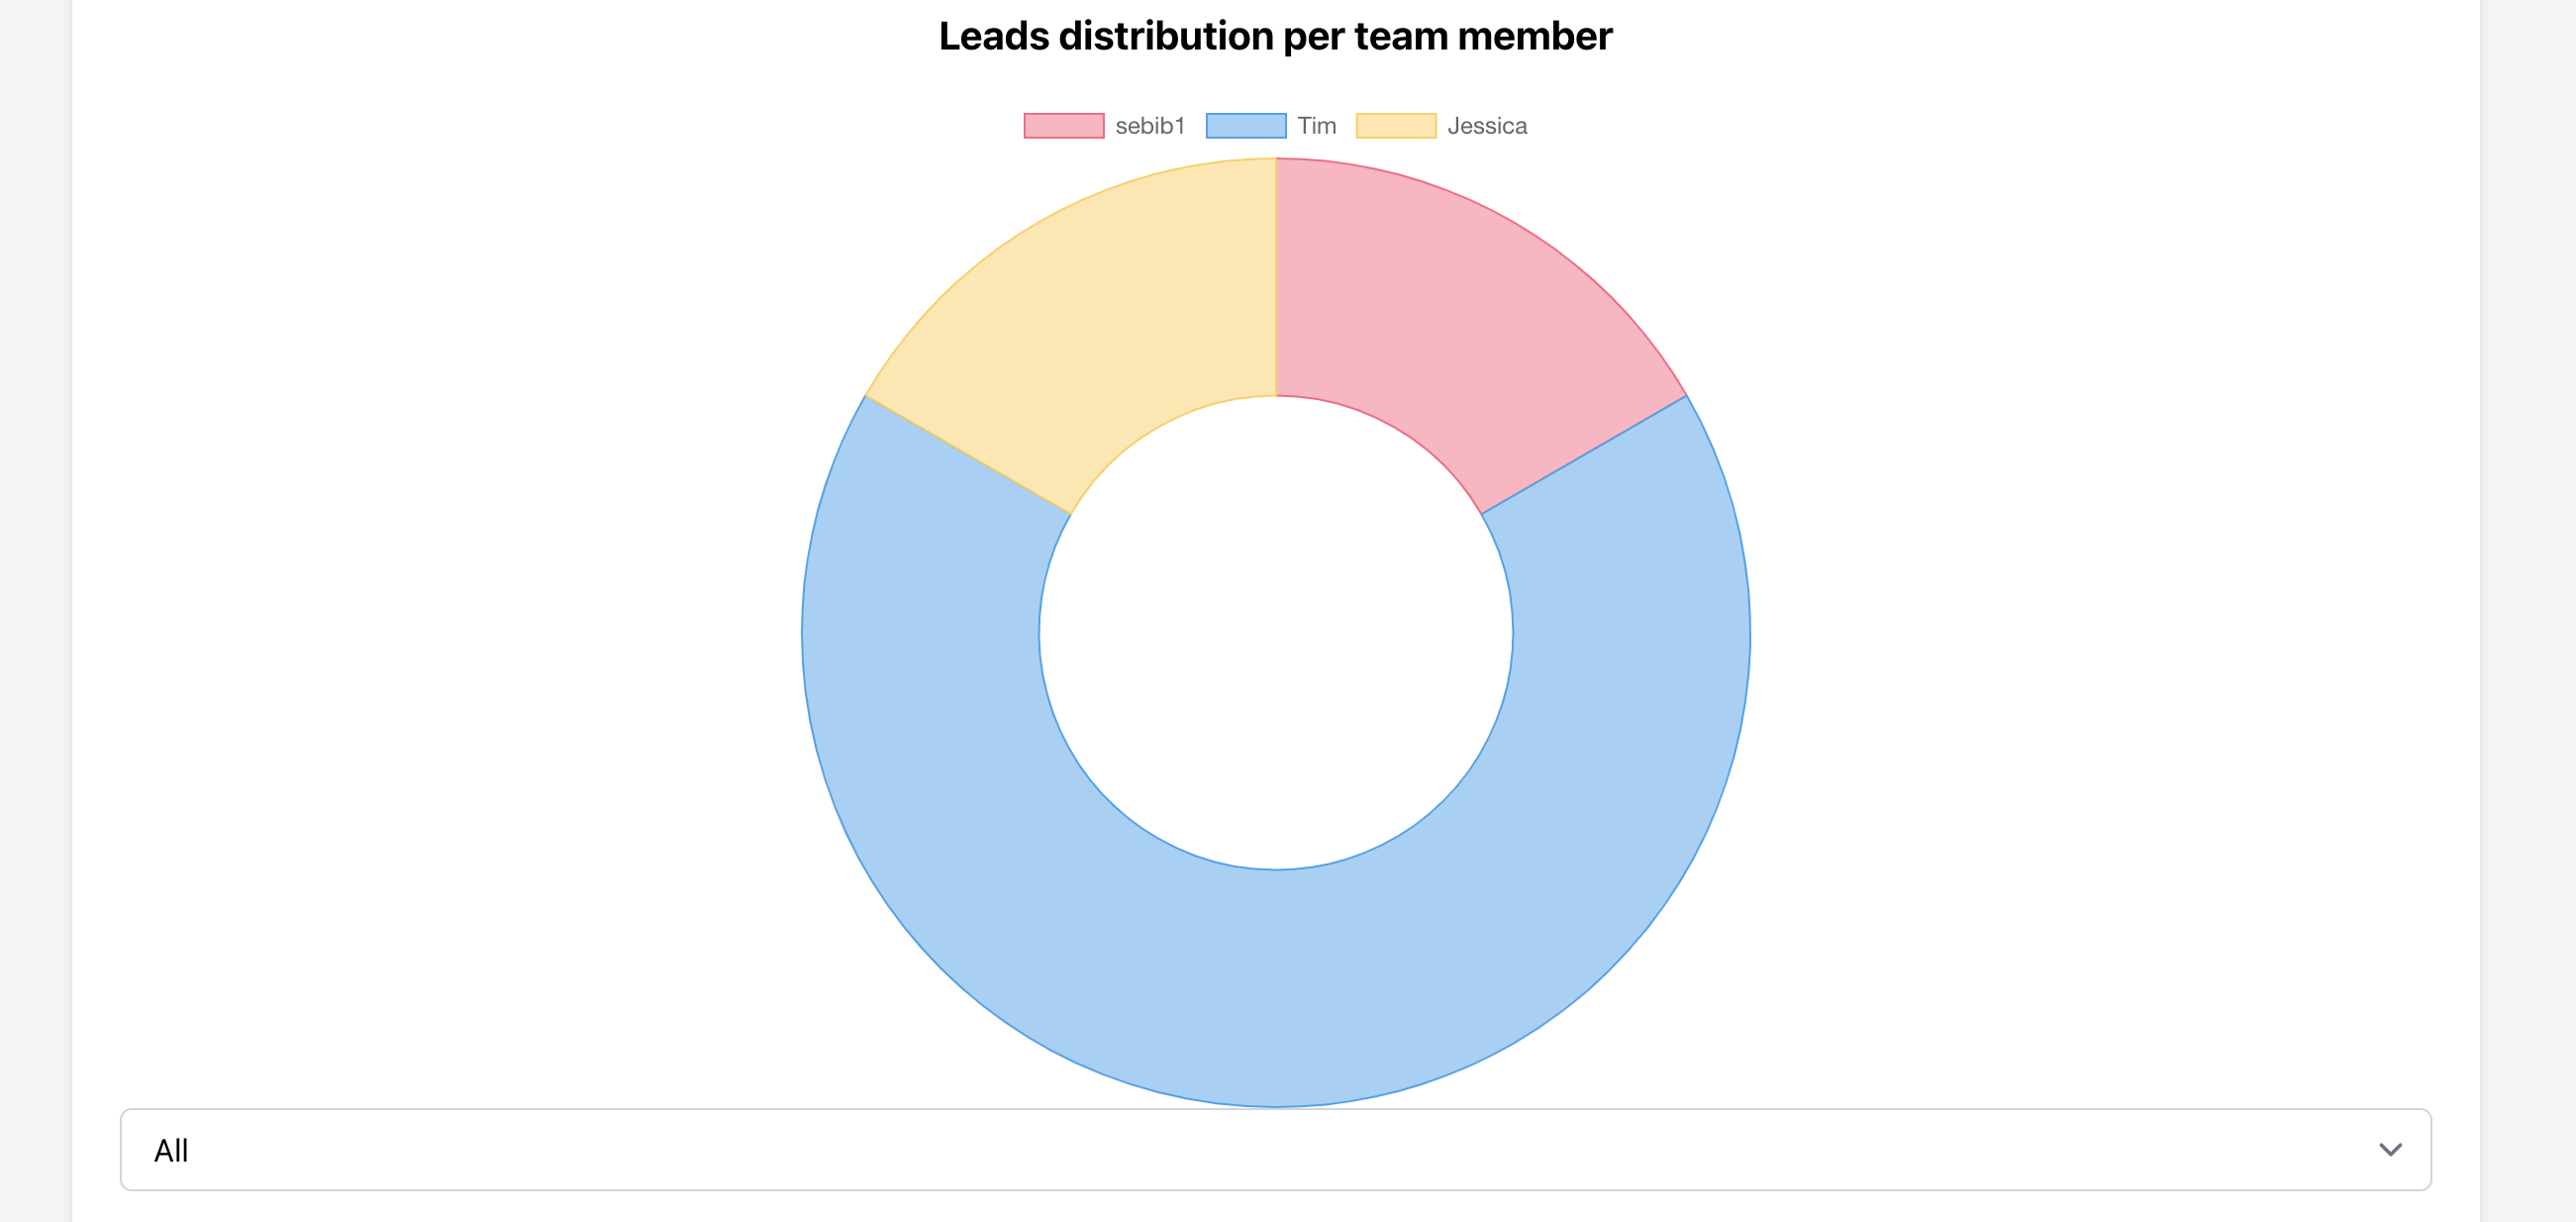
Lead Distribution per Team Member
This chart illustrates the distribution of leads across team members in PropertyCloudCRM. It provides real estate brokers with a clear overview of how many prospects are assigned to each team member, optimizing lead management in the broker software.
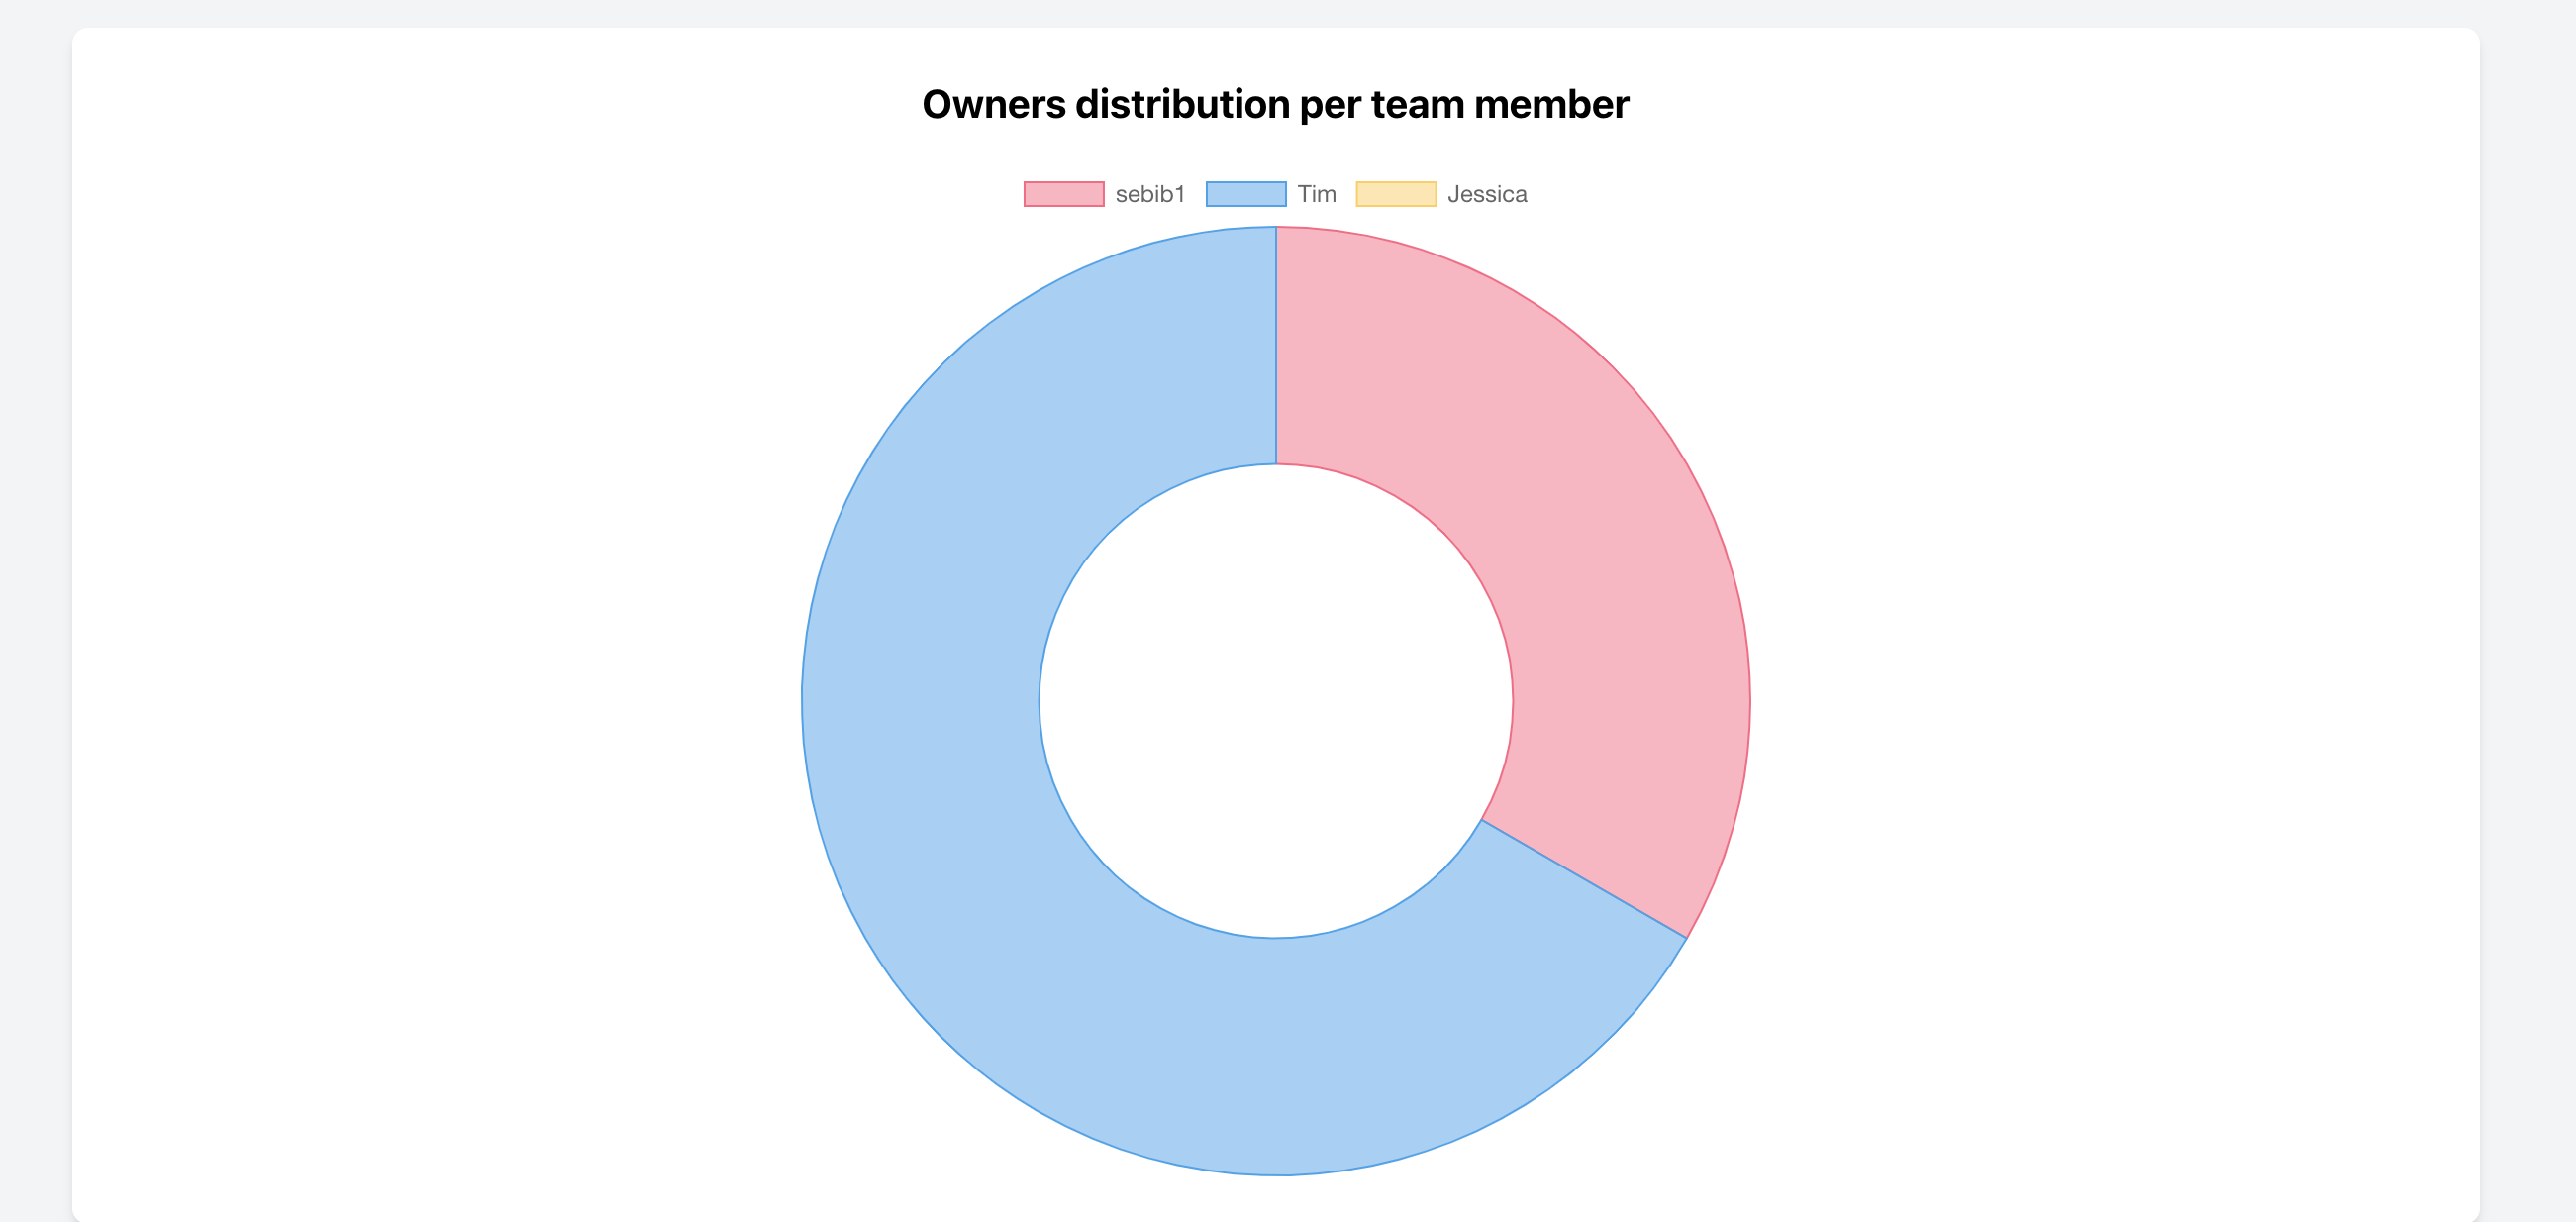
Owner Distribution per Team Member
The chart displays how property owners are distributed among team members in PropertyCloudCRM. This visualization helps brokers analyze the allocation of property portfolios and manage real estate assets more effectively.
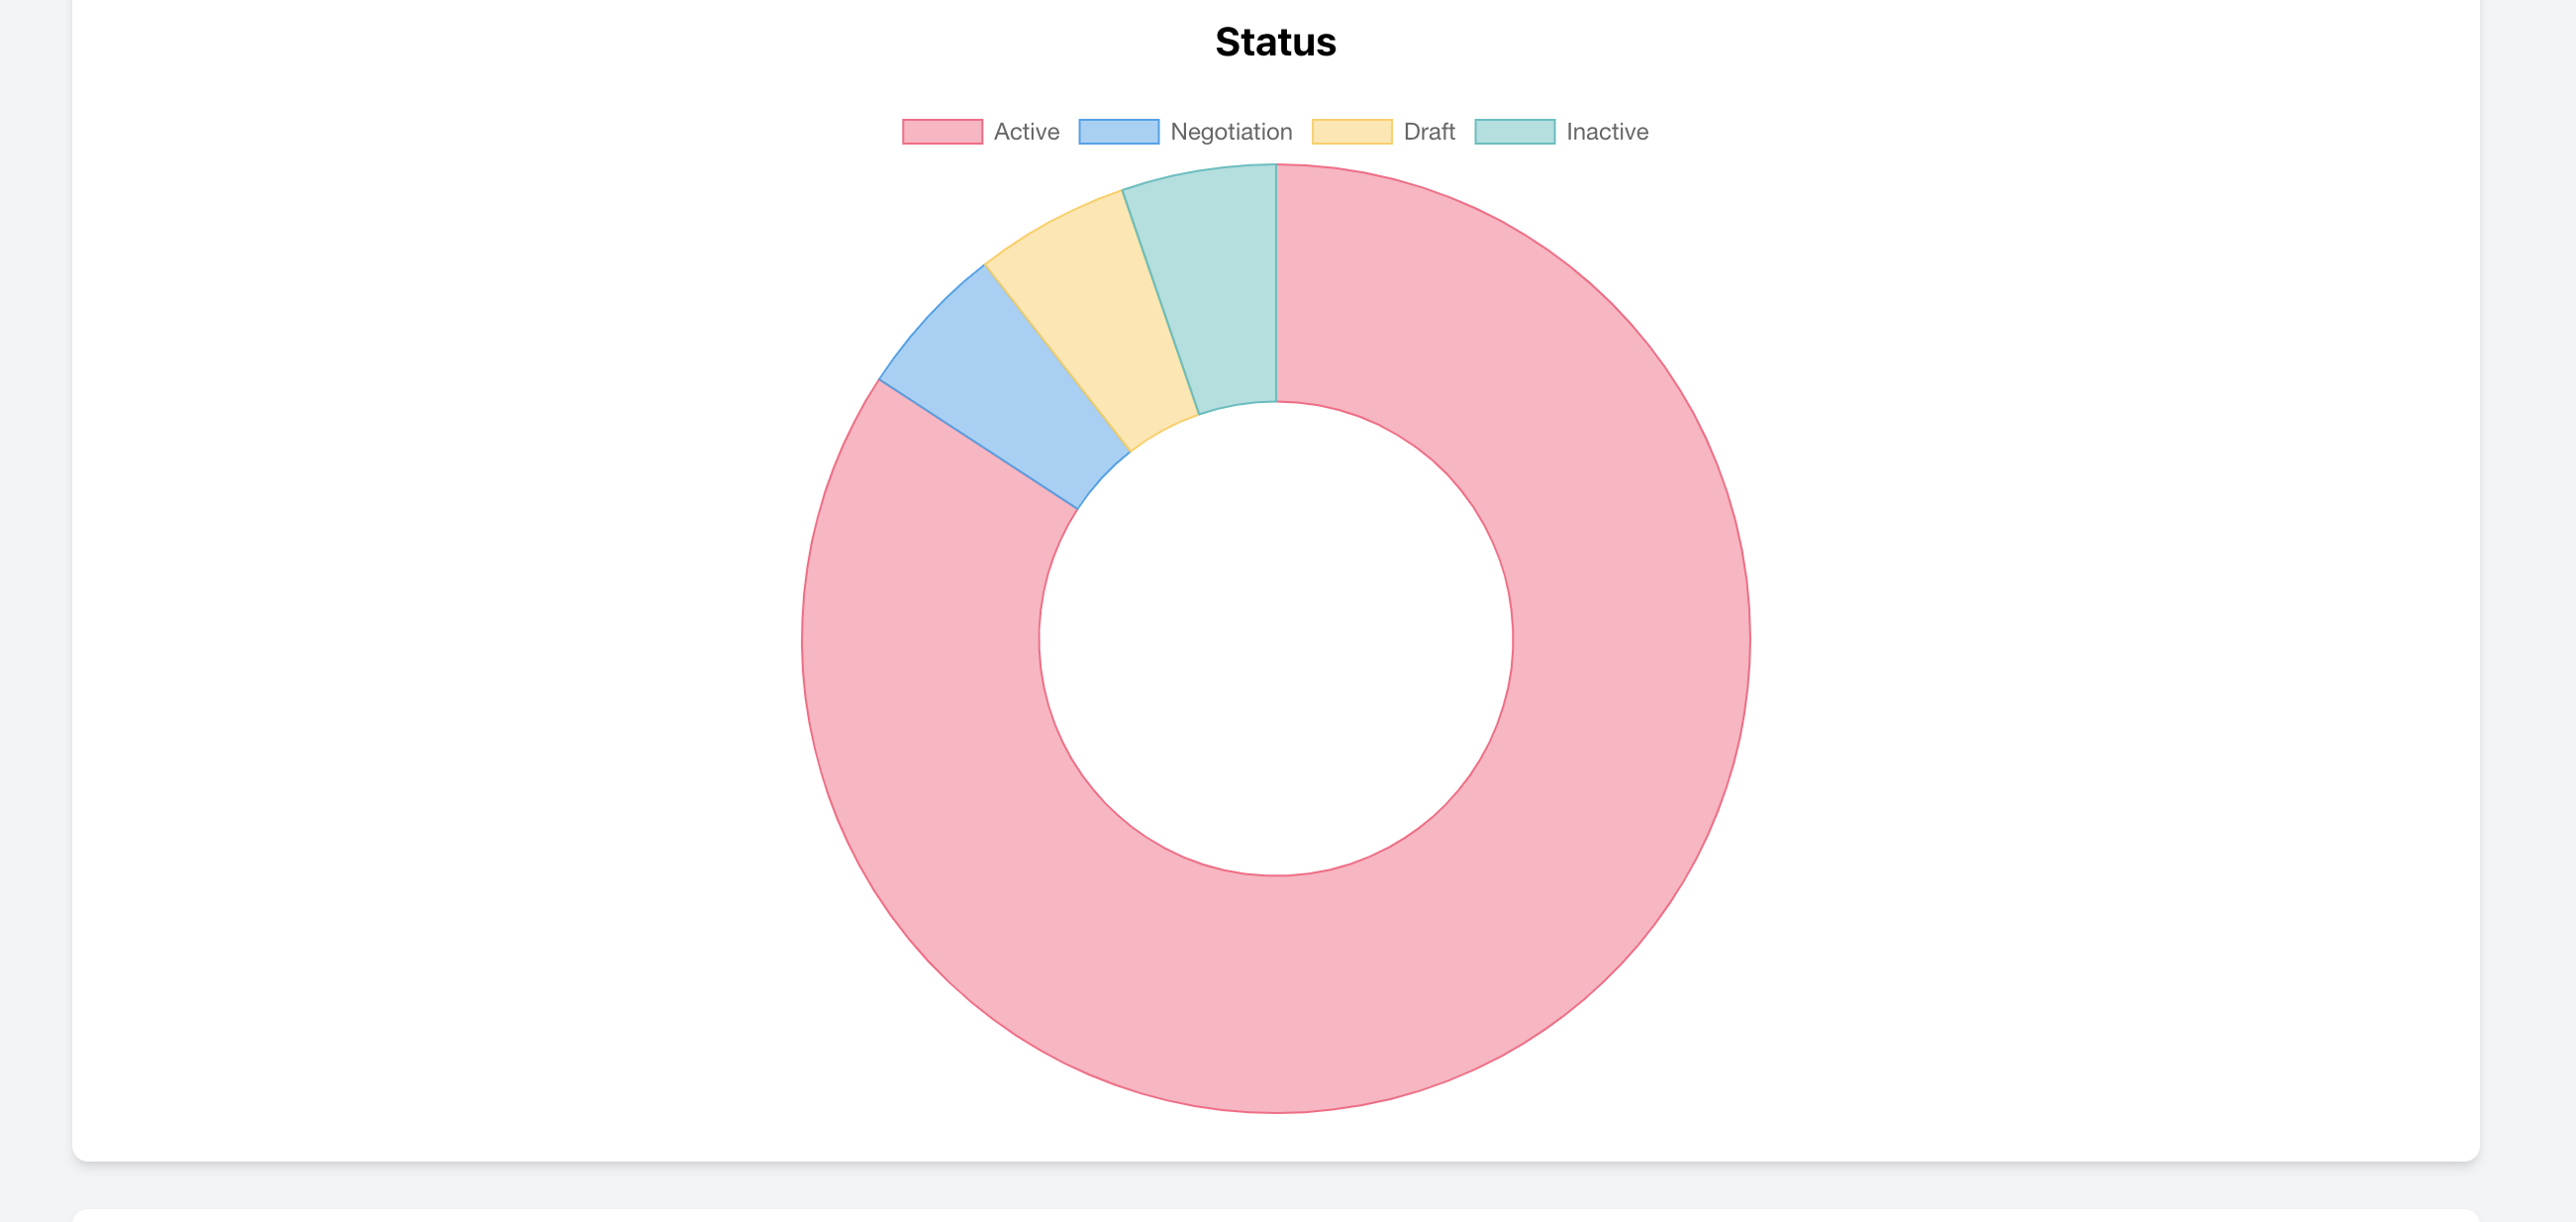
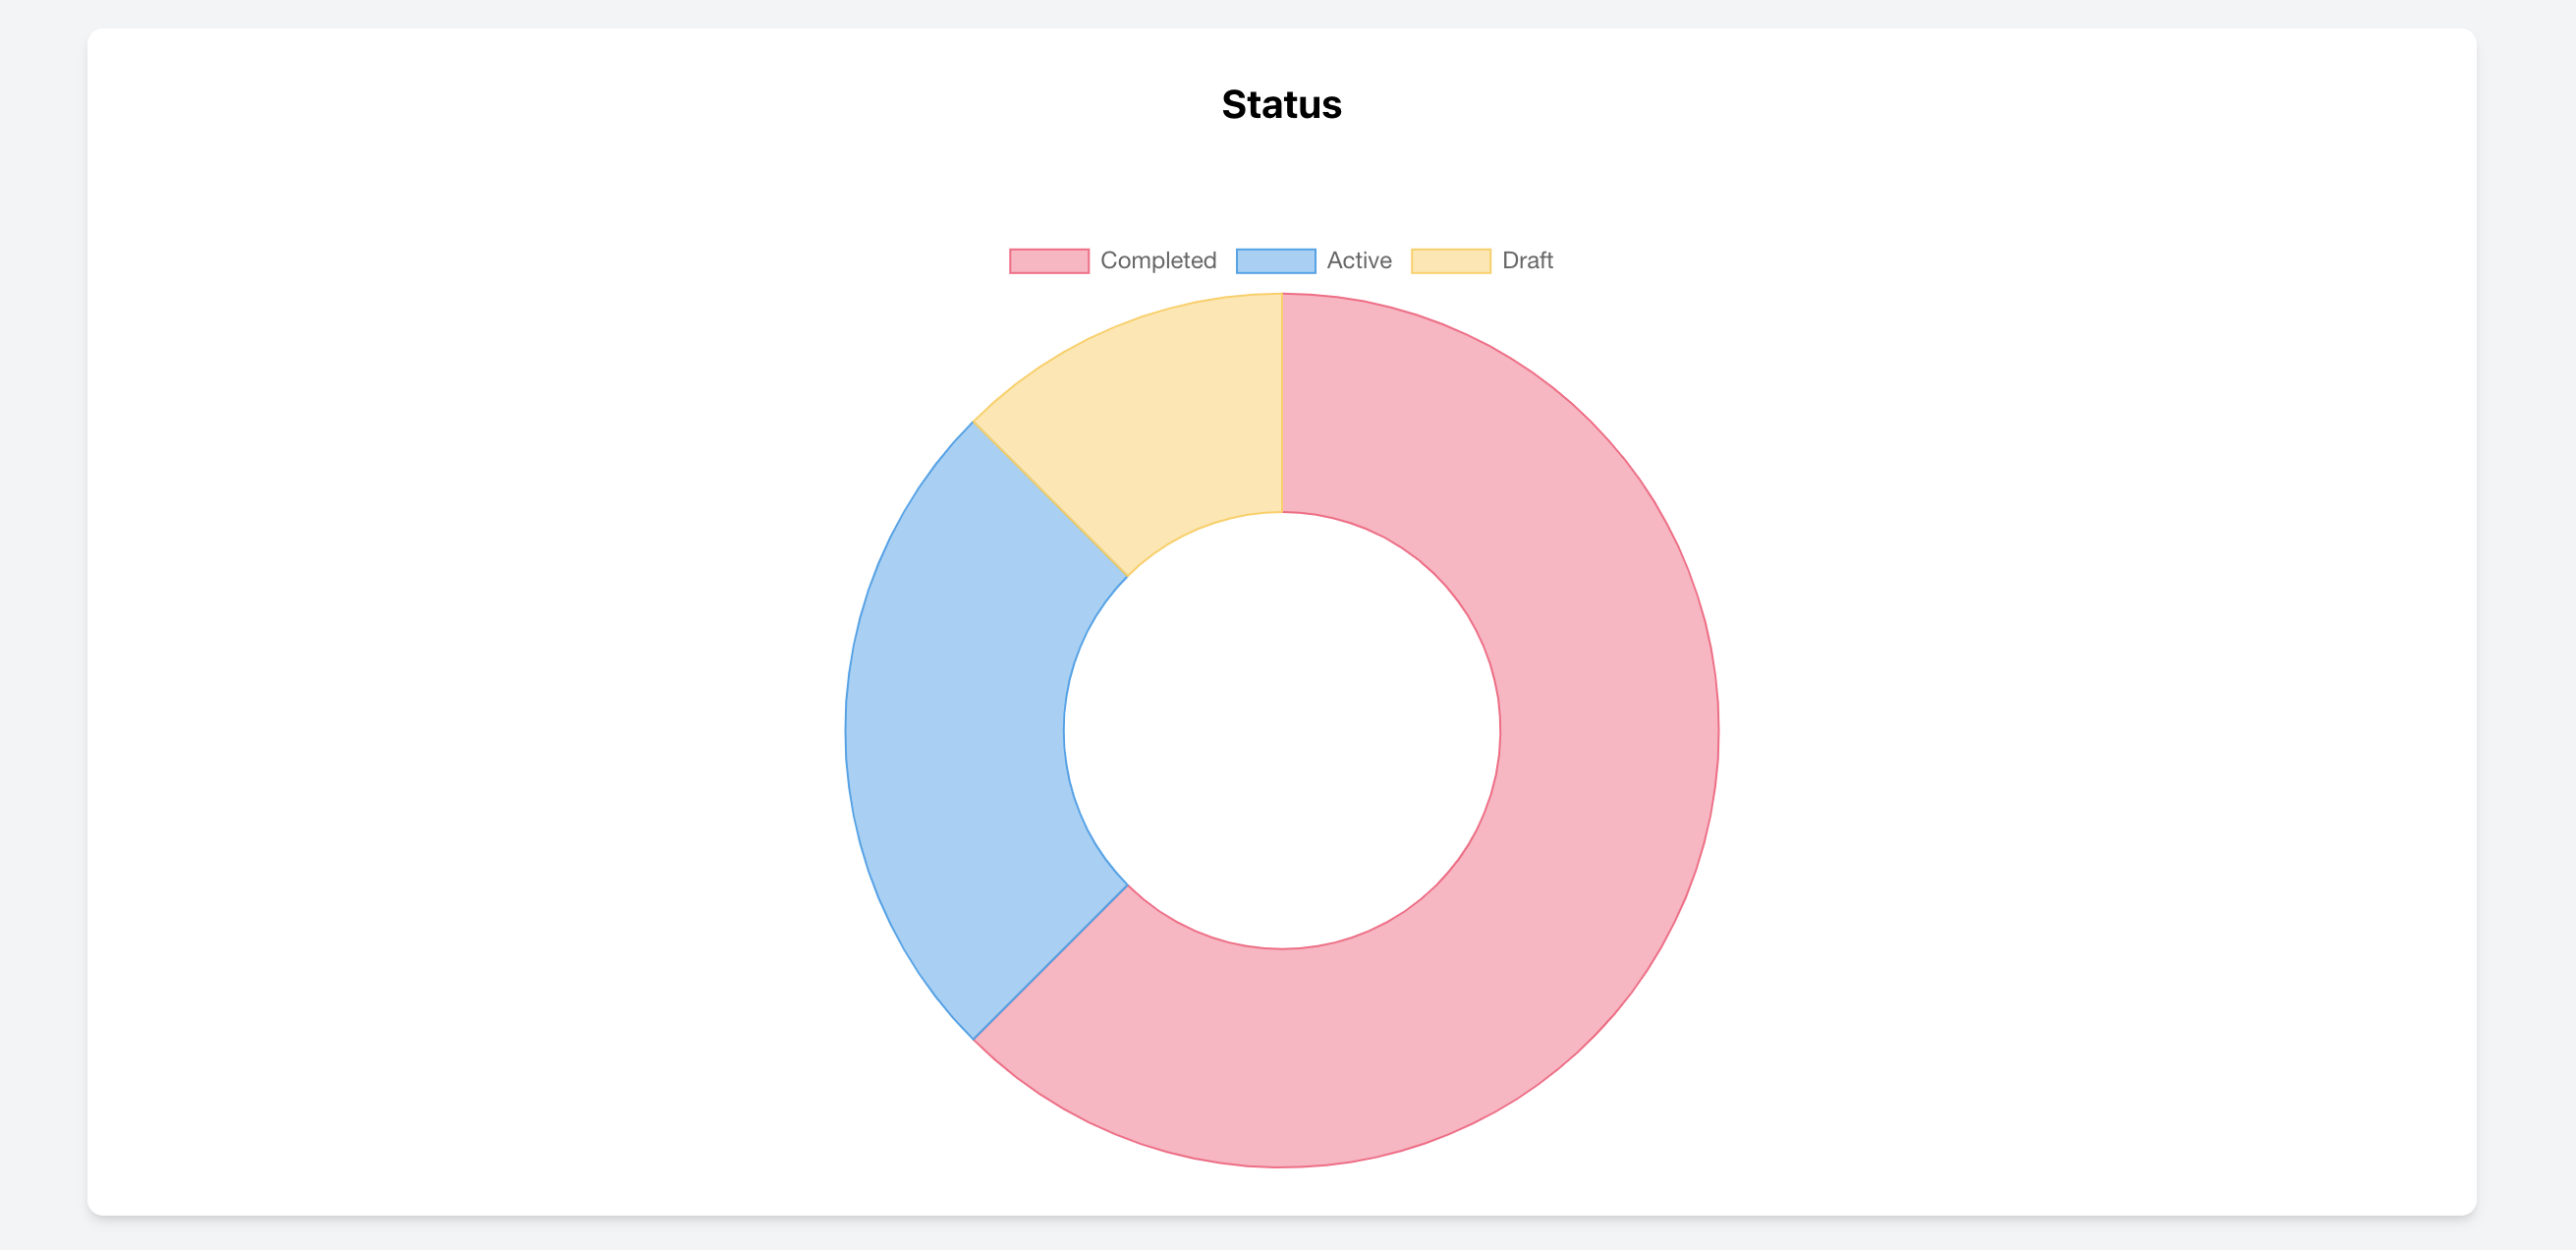
Property Status Distribution
This chart visualizes the status distribution of properties in PropertyCloudCRM. It shows how many properties are in various statuses—such as Draft, Active, Inactive, Under Negotiation, or Completed—providing brokers with a clear overview of their property portfolio.
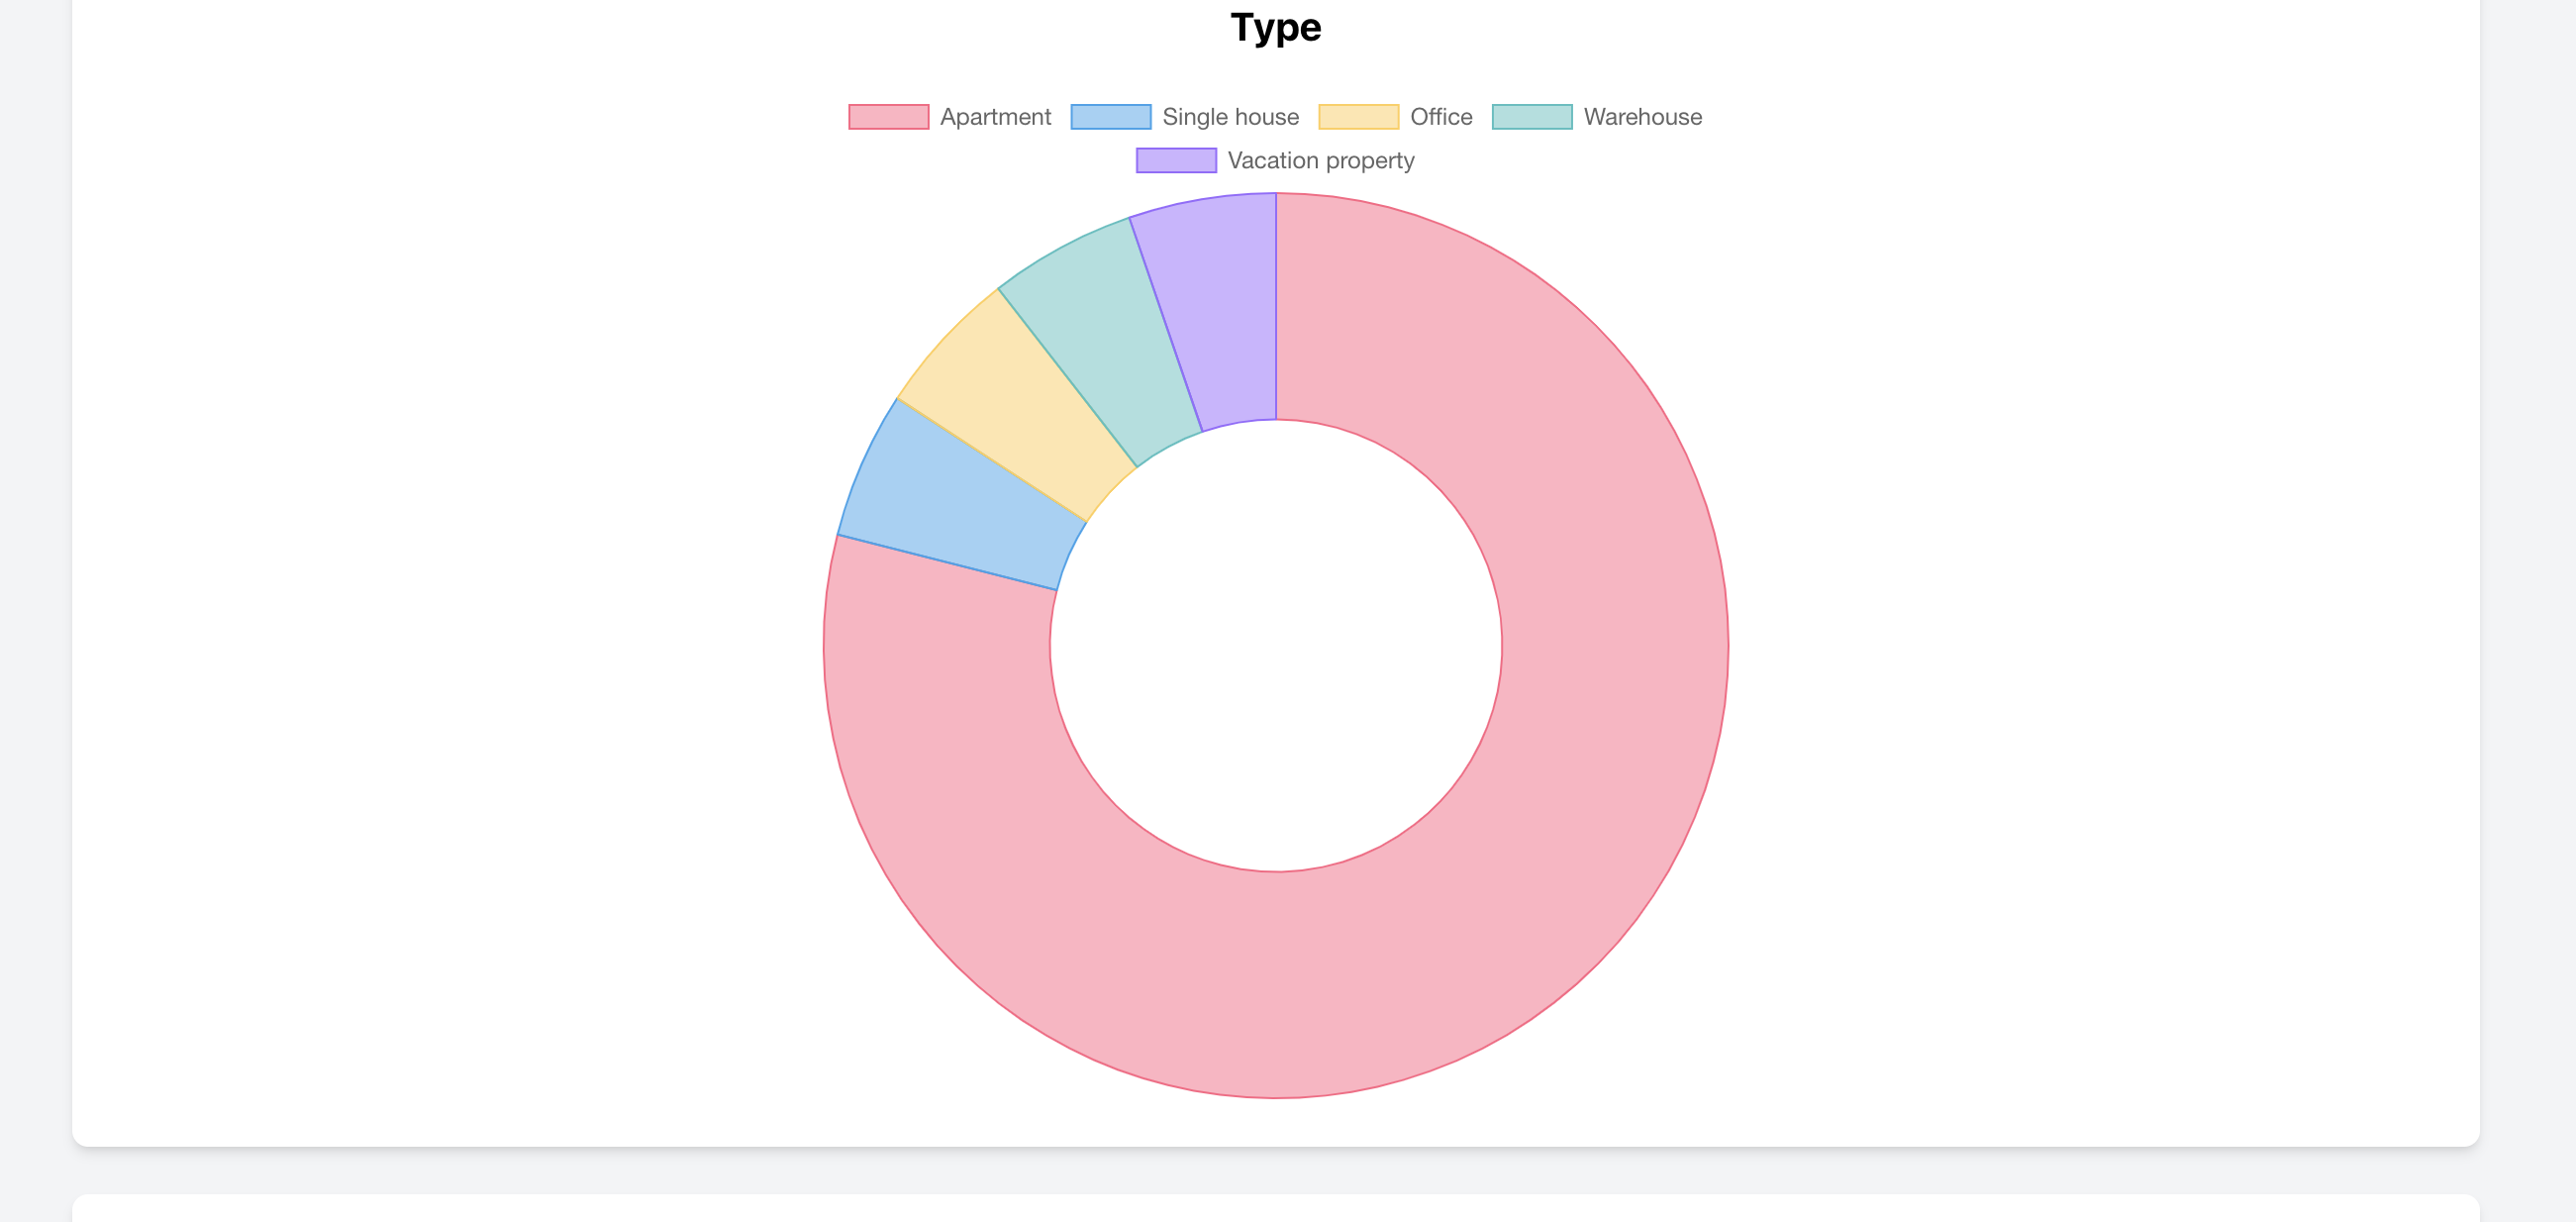
Property Type Distribution
The chart presents the distribution of properties by type in PropertyCloudCRM. It offers valuable insights into different property categories, helping brokers manage their portfolios and respond effectively to market trends.
Average Price per Property Type
This chart compares the average prices across various property types in PropertyCloudCRM. It provides a detailed overview of the pricing structure, enabling brokers to identify market trends and align their pricing strategies accordingly.

Property Prices in CRM
The bar chart displays current property prices in PropertyCloudCRM. Each bar represents the price of an individual property, with the corresponding property names shown at the bottom. This chart is perfect for visual price comparisons and market analysis in real estate management.

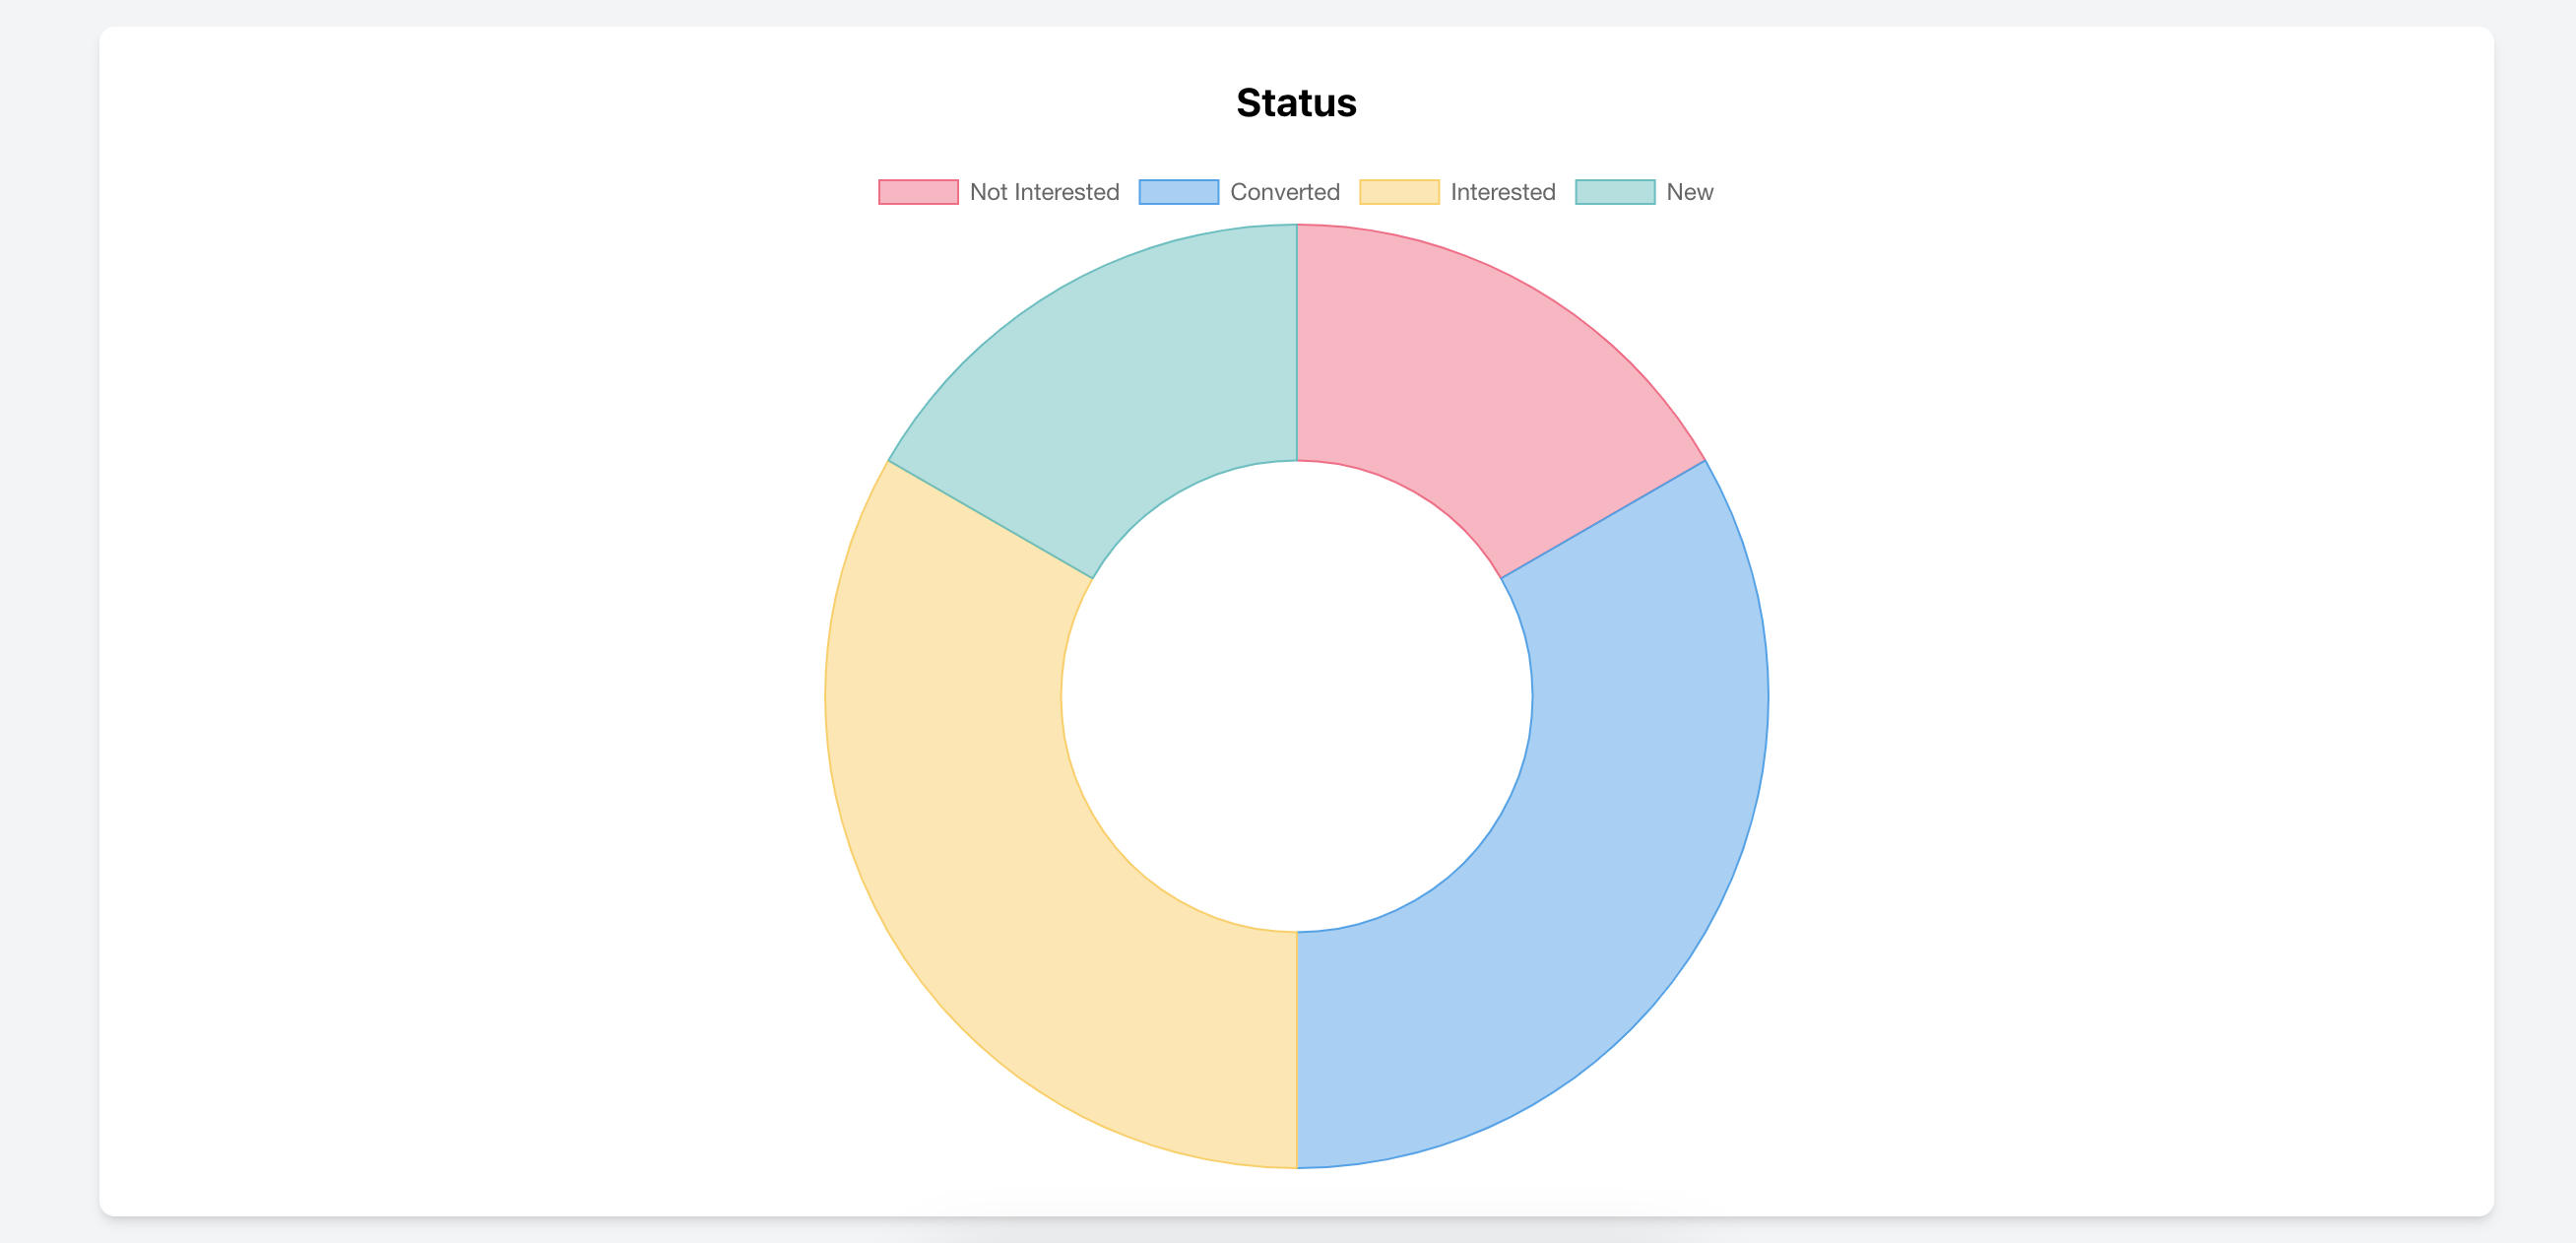
Lead Distribution by Status
This chart visualizes the distribution of leads by status in PropertyCloudCRM. It shows how many leads fall into the categories of New, Contacted, Interested, Not Interested, and Converted – an essential tool for optimizing lead management in real estate broker software.
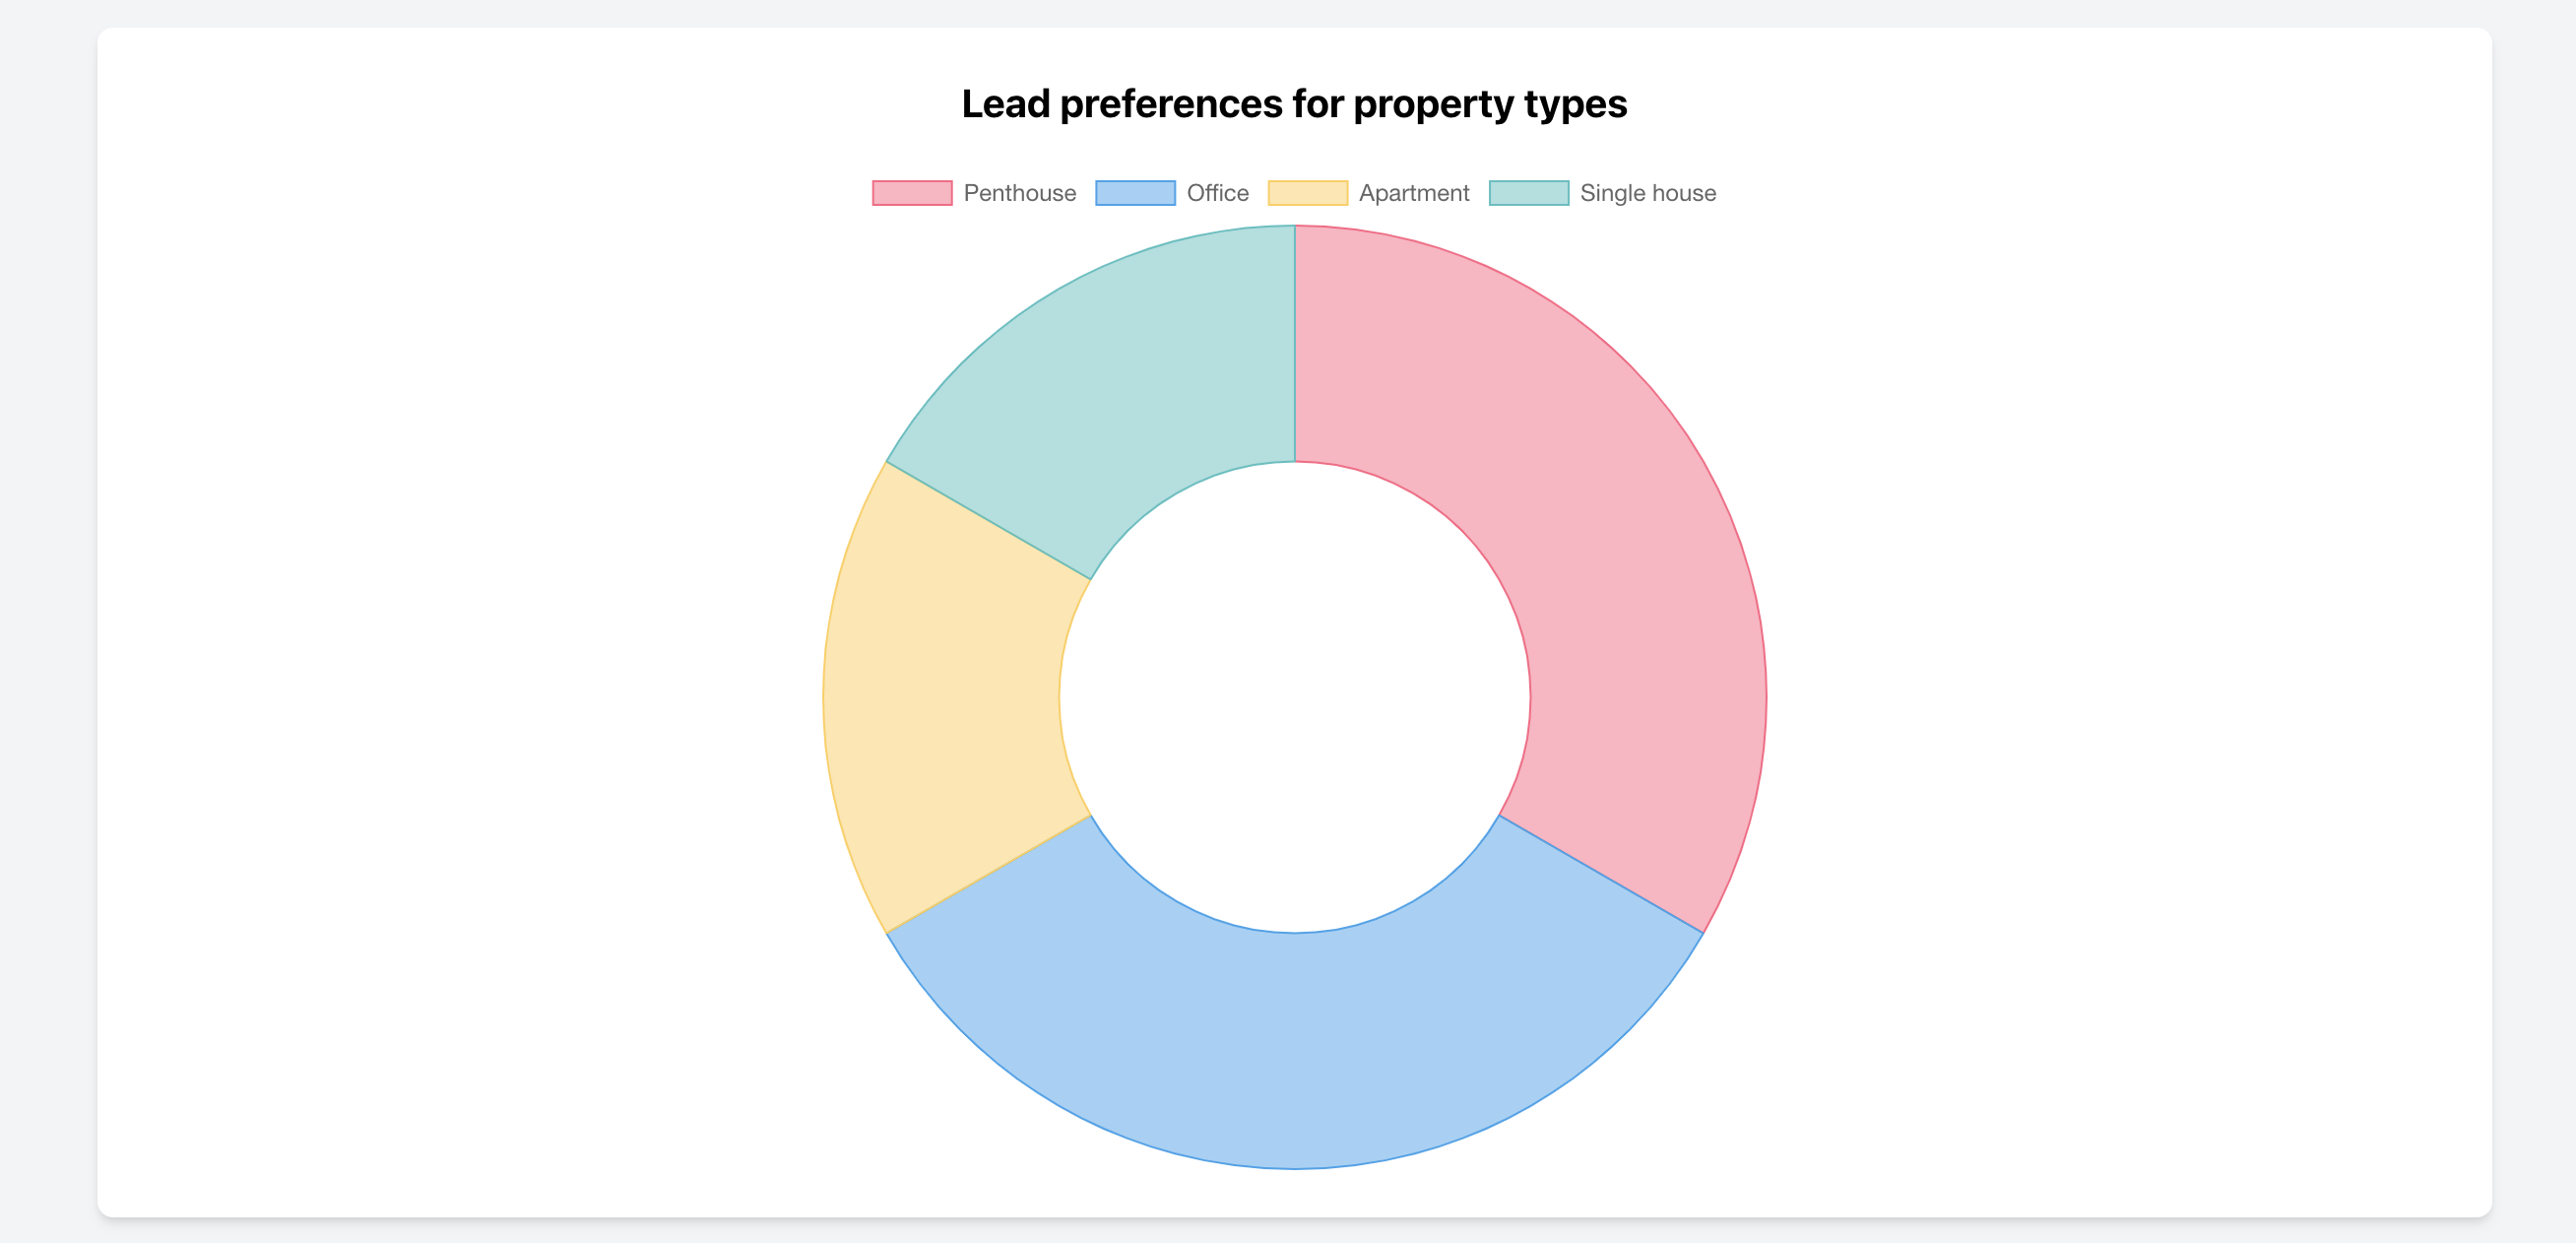
Lead Preferences by Property Type
The chart displays lead preferences regarding property types in PropertyCloudCRM. It provides brokers with a clear overview of which property categories are most in demand, supporting targeted marketing strategies in the real estate industry.
Average Lead Conversion Time by Month
This chart illustrates the average conversion time for leads, measured in days, across different months in PropertyCloudCRM. For example, it shows that the average conversion time was 17 days in January and 2 days in February – a critical metric for optimizing lead conversion strategies in real estate CRM.

Average Number of Properties per Owner
This statistic shows the average number of properties assigned to each owner in PropertyCloudCRM. It is an important metric for brokers to analyze the efficiency and distribution of property portfolios within their CRM solution.

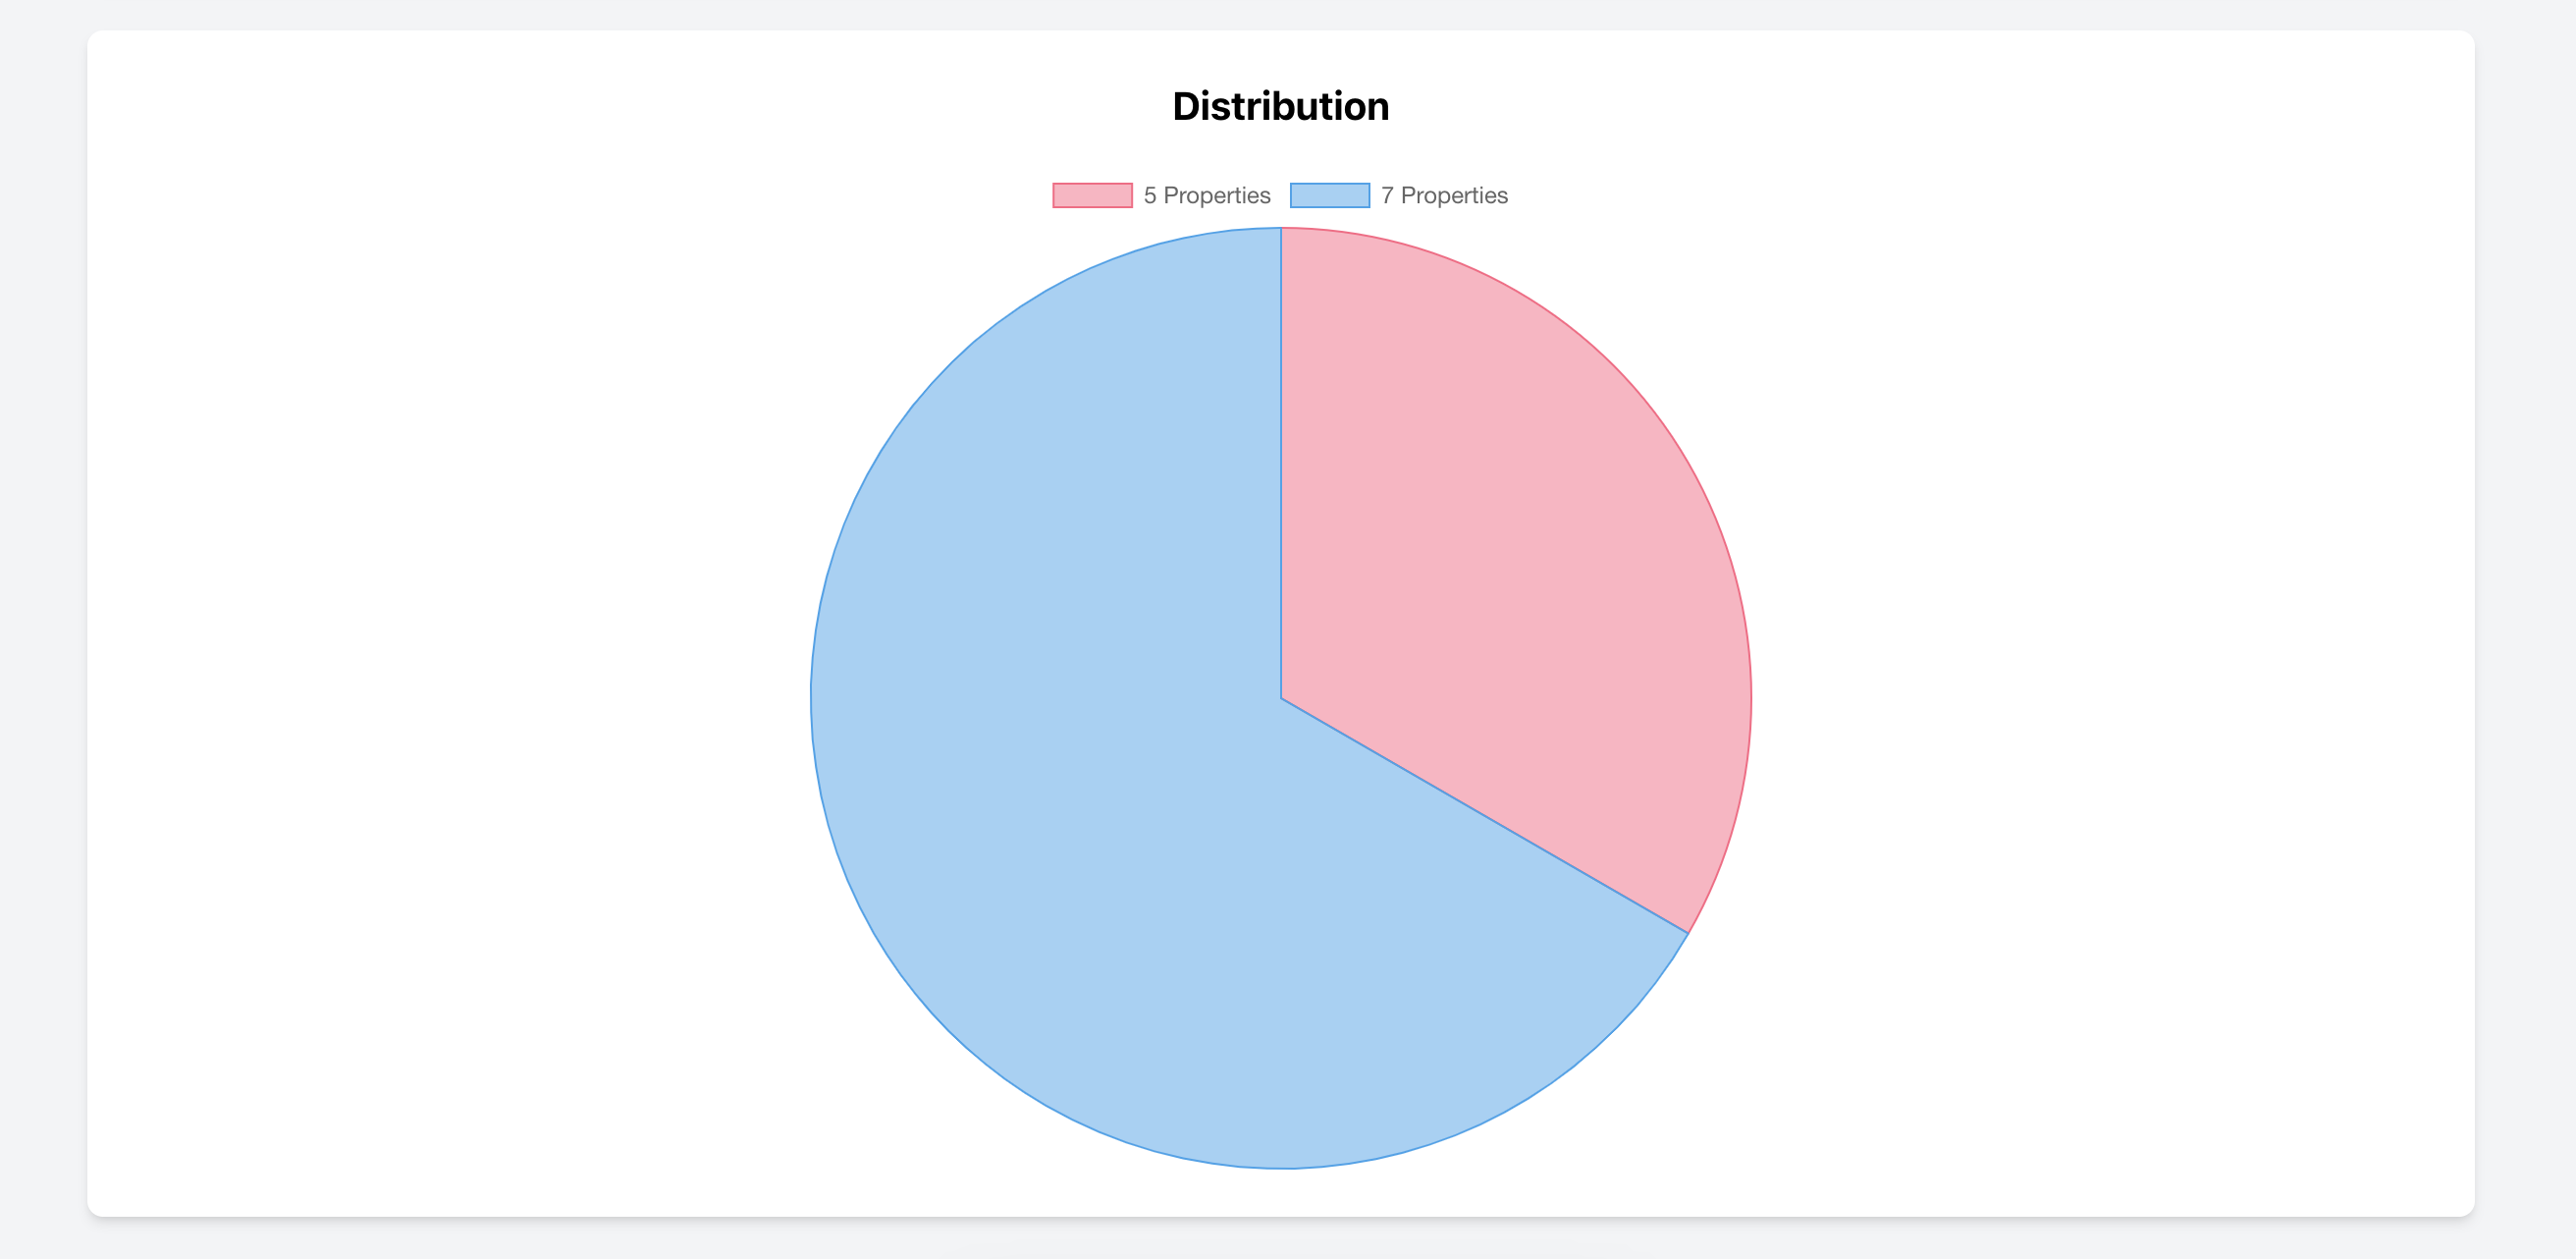
Distribution of Properties per Owner
This chart depicts the distribution of properties among owners in PropertyCloudCRM. It illustrates, for example, that one owner may have 12 properties while two others have 3 properties each – ideal for a detailed analysis of property allocation in real estate management.
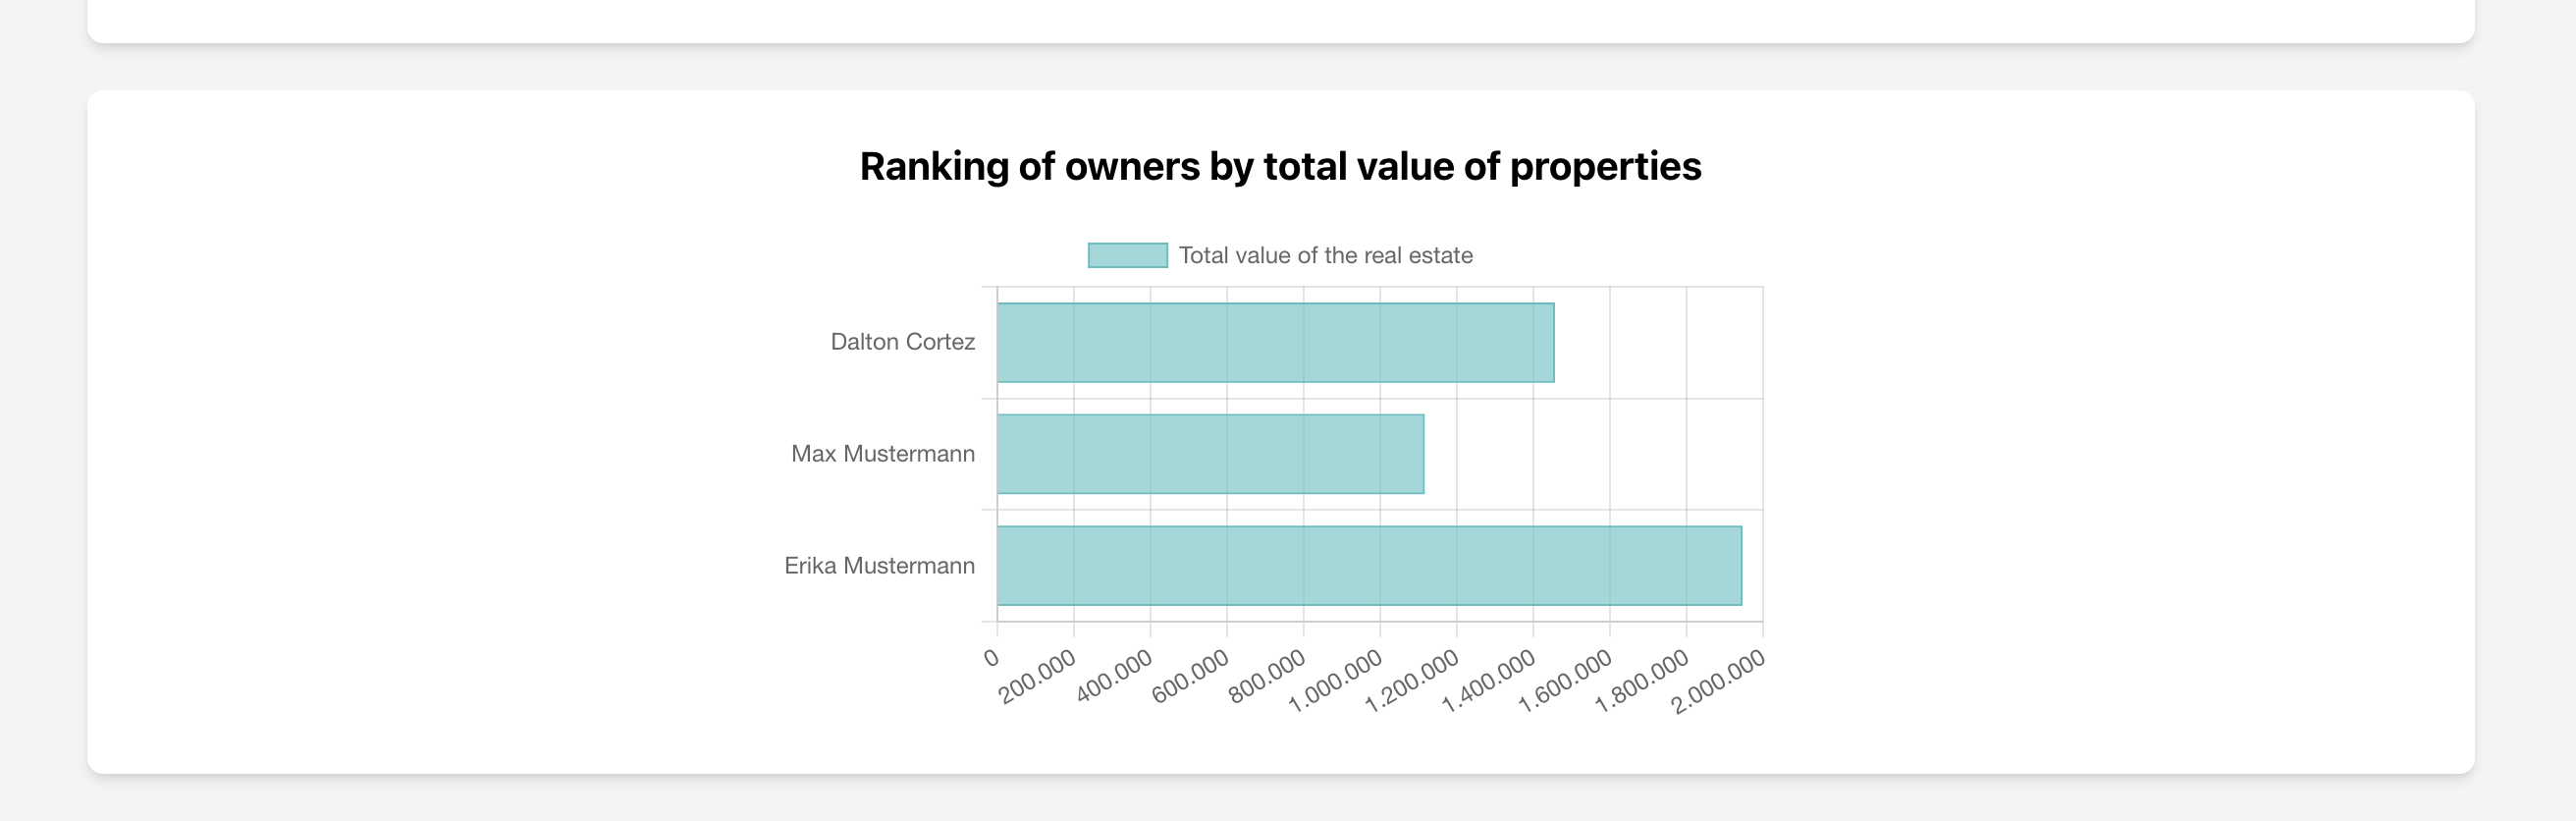
Ranking of Owners by Total Property Value
This chart ranks property owners in PropertyCloudCRM based on the total value of their properties. It provides a clear leaderboard, enabling brokers to identify the most valuable property portfolios and strategically manage their assets – a crucial factor in modern real estate management.
Campaigns by Status
This chart displays the distribution of marketing campaigns in PropertyCloudCRM by their current status, such as Draft, Active, or Completed. It allows real estate brokers to quickly assess the progress and activity of their marketing efforts within the CRM.
Active Campaigns and Their Progress
This chart visualizes the progress of active marketing campaigns in PropertyCloudCRM based on click counts. It provides real estate brokers with clear insights into the performance of ongoing campaigns, supporting the optimization of marketing strategies in the broker software.

Completed Campaigns and Their Results
This chart shows the results of completed marketing campaigns in PropertyCloudCRM based on the number of clicks on embedded links. It offers valuable insights for brokers to analyze the success of past campaigns and enhance future marketing strategies in real estate management.

...